Room by room
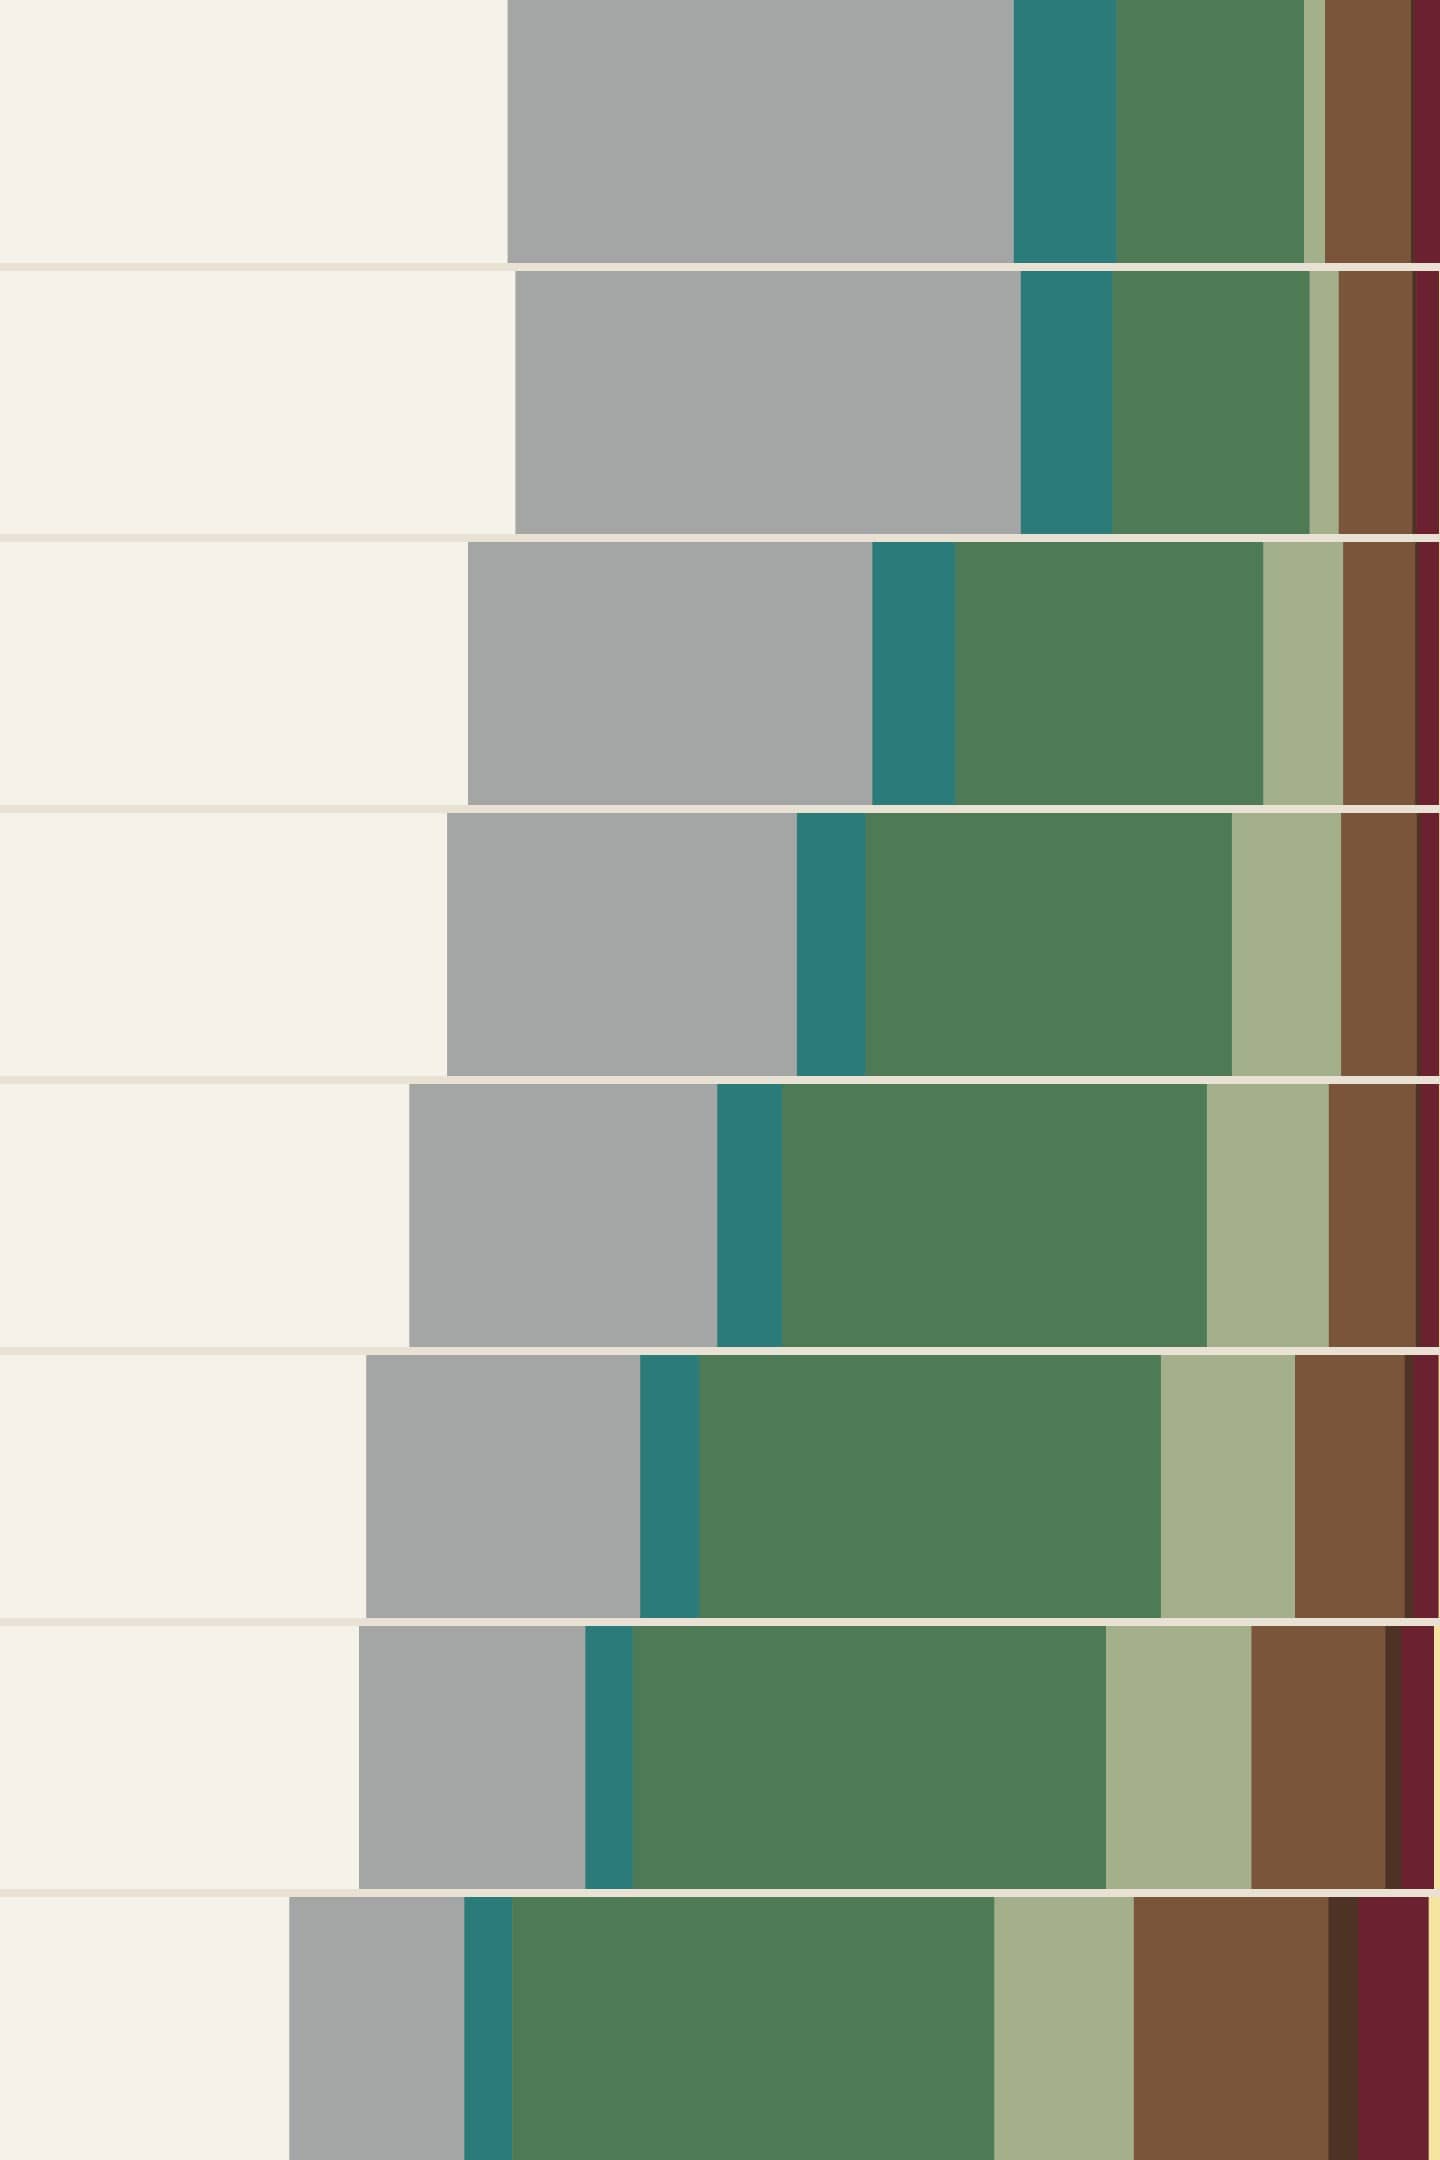
The whole-home numbers hide the best part: most rooms swapped their color. The kitchen went from 39.1% white to 32.9% green. More on what that means for your place in my 2026 color trends guide.
| Room or piece | 2019 | 2026 |
|---|---|---|
| living roomNew leader | gray30.6% | green15.8% |
| bedroomNew leader | gray22.7% | black24.2% |
| kitchenNew leader | white39.1% | green32.9% |
| kitchen cabinetsSame leader | white35.8% | white19.3% |
| bathroomNew leader | gray20.7% | green14.2% |
| sofaNew leader | gray24.1% | green16.3% |
| beddingSame leader | white15.1% | white18.3% |
| rugNew leader | gray13.5% | green13.4% |
| accent wallNew leader | blue18.8% | black23.4% |
The color with the biggest share of searches for each room or piece, January to August.
Questions people ask
What was the most popular home color in 2019?
Gray and white, tied at the top, at 18.8% each of home color searches. Gray ruled the living room: 30.6% of living room color searches were for a gray one, almost one in three.
What is the most popular home color in 2026?
Green, at 15.8% of home color searches from January to August 2026. It has led every year since 2023. Black (10.5%) and white (9.5%) follow.
What is the most popular color for a couch?
Green, at 16.3% of sofa and couch color searches in 2026. Black (11.7%) and brown (10.0%) follow, while gray, the 2019 favorite at 24.1%, is down to 7.1%.
Are brown sofas back in style?
Yes. Brown went from 4.7% of sofa color searches in 2023 to 10.0% in 2026, and "chocolate brown couch" from about 290 searches a month in 2019 to about 4,000.
What sofa colors will look outdated in 2026?
Going by searches, gray, white and blue are the sofa colors people have moved on from. Gray fell from 24.1% of sofa color searches in 2019 to 7.1% in 2026, white from 12.2% to 7.9%, and blue from 12.0% to 6.6%.
Which home colors are trending up for 2026?
Since 2023, brown (2.9% to 6.4%), burgundy (0.6% to 2.3%) and pink (7.3% to 8.9%) have gained the most. The smaller ones are moving fastest: "chocolate brown couch" went from about 290 searches a month in 2019 to about 4,000, and "butter yellow kitchen" from 46 in 2023 to 529.
See all the numbers
Share of home color searches for each color, in percent, January to August of each year. Sorted by 2026. Download the table (CSV)
| Color | 2019 | 2020 | 2021 | 2022 | 2023 | 2024 | 2025 | 2026 |
|---|---|---|---|---|---|---|---|---|
| green | 7.0 | 7.4 | 11.1 | 12.9 | 14.4 | 15.3 | 16.0 | 15.8 |
| black | 9.8 | 10.5 | 12.2 | 13.6 | 14.1 | 13.0 | 12.0 | 10.5 |
| white | 18.8 | 19.3 | 16.8 | 15.7 | 13.8 | 12.1 | 12.1 | 9.5 |
| pink | 7.1 | 5.8 | 6.3 | 6.6 | 7.3 | 7.7 | 7.7 | 8.9 |
| blue | 11.1 | 9.8 | 9.4 | 9.2 | 9.0 | 8.8 | 8.3 | 8.2 |
| brown | 3.2 | 2.8 | 2.6 | 2.7 | 2.9 | 3.6 | 4.5 | 6.4 |
| gray | 18.8 | 18.9 | 14.5 | 12.3 | 10.4 | 9.1 | 7.7 | 5.7 |
| sage green | 0.8 | 1.1 | 2.9 | 3.8 | 4.1 | 4.4 | 4.9 | 4.6 |
| beige | 2.0 | 2.1 | 2.4 | 2.6 | 3.2 | 3.8 | 4.1 | 4.1 |
| cream | 1.5 | 1.9 | 2.2 | 2.4 | 2.7 | 3.0 | 3.0 | 3.6 |
| yellow | 5.3 | 4.5 | 3.7 | 3.0 | 2.8 | 2.6 | 2.6 | 2.6 |
| burgundy | 0.9 | 0.9 | 0.7 | 0.6 | 0.6 | 0.8 | 1.1 | 2.3 |
| olive green | 0.7 | 0.8 | 1.0 | 1.2 | 1.5 | 1.9 | 2.0 | 2.3 |
| terracotta | 0.4 | 0.6 | 0.8 | 0.9 | 1.1 | 1.2 | 1.2 | 1.8 |
| taupe | 0.8 | 1.0 | 1.0 | 1.1 | 1.2 | 1.5 | 1.5 | 1.7 |
| teal | 3.8 | 3.4 | 3.0 | 2.4 | 2.2 | 2.0 | 1.6 | 1.6 |
| navy | 2.1 | 2.4 | 2.4 | 2.2 | 1.9 | 1.9 | 1.6 | 1.5 |
| burnt orange | 0.7 | 0.9 | 1.0 | 0.9 | 1.0 | 1.3 | 1.1 | 1.3 |
| emerald green | 0.9 | 1.2 | 1.5 | 1.4 | 1.2 | 1.3 | 1.4 | 1.2 |
| mauve | 0.5 | 0.5 | 0.4 | 0.4 | 0.5 | 0.6 | 0.7 | 1.0 |
| chocolate brown | 0.1 | 0.1 | 0.1 | 0.1 | 0.2 | 0.3 | 0.6 | 1.0 |
| charcoal | 0.4 | 0.5 | 0.5 | 0.5 | 0.5 | 0.5 | 0.8 | 0.8 |
| rust | 0.2 | 0.5 | 0.8 | 0.7 | 0.7 | 0.7 | 0.7 | 0.7 |
| forest green | 0.3 | 0.4 | 0.6 | 0.6 | 0.7 | 0.7 | 0.7 | 0.7 |
| lavender | 1.1 | 1.0 | 0.8 | 0.8 | 0.7 | 0.8 | 0.7 | 0.7 |
| greige | 0.4 | 0.4 | 0.4 | 0.5 | 0.5 | 0.5 | 0.5 | 0.5 |
| mustard yellow | 0.5 | 0.5 | 0.5 | 0.4 | 0.4 | 0.4 | 0.4 | 0.4 |
| butter yellow | 0.0 | 0.0 | 0.0 | 0.0 | 0.0 | 0.0 | 0.2 | 0.4 |
| blush pink | 0.7 | 0.6 | 0.4 | 0.3 | 0.3 | 0.3 | 0.4 | 0.3 |
How to read these numbers
Every number here is a share. I take all the US Google searches for a color plus a room or a piece ("sage green kitchen cabinets", "chocolate brown couch") and look at how many went to each color, January to August of each year, 2019 to 2026. That's 29 colors and 280 searches. Google sometimes counts two ways of saying the same thing together (couch and sofa, gray and grey), so each is counted once. In 2020 everyone searched about twice as much, so that year shows on the charts but never counts as a peak. Searches like "yellow walls" are left out (that one jumps for reasons that have nothing to do with paint); accent wall searches are kept as their own category.